 CMSDocumentation

Website administration
Stats
Stats shows how much your shop has taken. It's the first screen in Ecommerce.
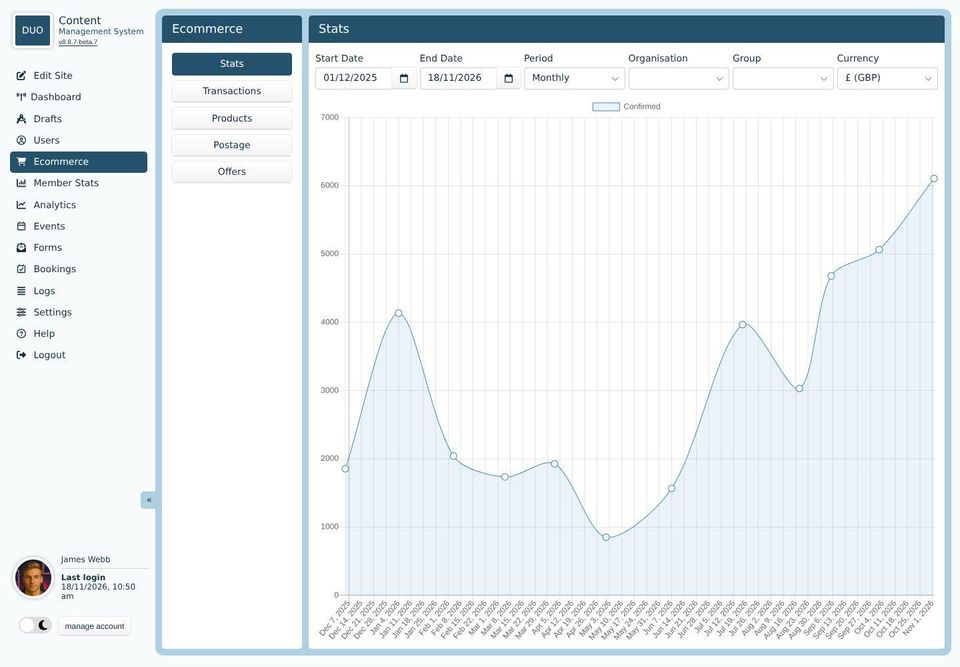
The graph shows the total of paid orders in each day, week or month. Point at a dot to see its total.
Choosing what to show

Start Date: the first day to show.
End Date: the last day.
Period: whether each point on the graph is a day, a week or a month. Monthly is easiest to read over a year.
Organisation: only orders from people in one organisation.
Group: only orders from people in one group.
Currency: on websites that take more than one currency, which to show. Each currency is counted separately.
The graph changes as soon as you change a box. The web address changes too, so you can bookmark a view you use often, such as this year by month.
Unpaid orders aren't counted. To see every order, paid or not, use Transactions.